Projects
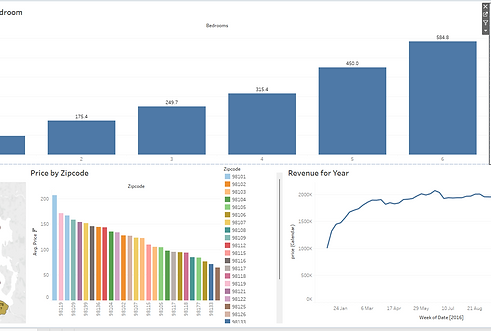
Airbnb Data Insights: Price and Revenue Trends
Analyzed Airbnb data using Tableau to uncover trends in average prices per bedroom, price distribution by zip code, and annual revenue. Visualized key insights with bar charts, maps, and time-series graphs for market analysis.
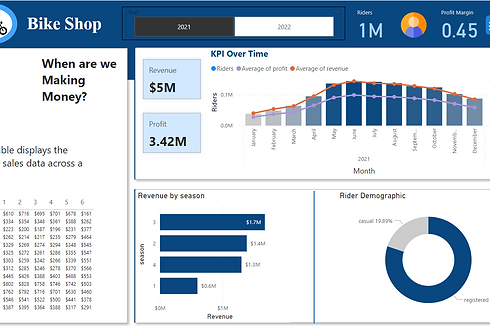
Bike Shop Sales Analysis: Trends and Demographics
Here I have used Power BI to analyse sales data from a bike shop. To aid in making well-informed business decisions, important data on sales patterns, rider demographics, revenue, and profit over time were visualised.
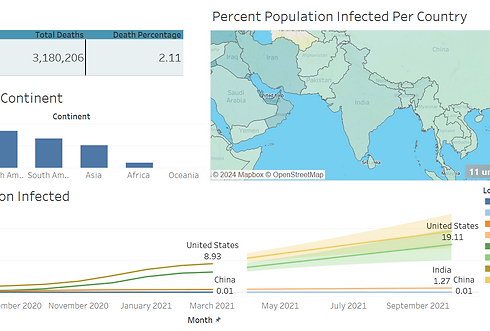
Covid Data Exploration using SQL
Conducted an in-depth analysis of COVID-19 data using SQL to explore infection rates, death percentages, and vaccination coverage globally. Utilized advanced SQL techniques and created a reusable SQL view for population vaccination analysis. Plan to visualize the results using Tableau for comprehensive insights.
COVID-19 Data Visualization: Uncovering Pandemic Insights
The COVID-19 Data Visualization project provides a comprehensive analysis of the pandemic's trends using Python, Pandas, and Matplotlib. It features data cleaning, preprocessing, and insightful visualizations of daily cases, recoveries, and fatalities, offering a clear understanding of global and country-specific impacts. By transforming complex data into dynamic visualizations, the project highlights the power of data-driven insights in addressing real-world challenges.